Student Goals & Achievements
(Updated August 2025)
Table of Contents
College
Business
Divinity
Graduate School
Law
Medicine
Professional Studies
College
Wake Forest University strives to be a dynamic and diverse learning community, valuing knowledge, experience, and service for the benefit of humanity in the liberal arts tradition. It expects to prepare all its undergraduate students, who must meet a core liberal arts curriculum requirement, a major requirement, and a 120 credit hour requirement to graduate, to be active and informed members of the world in which they live. In line with these aims, the institution assesses student achievement using a variety of measures, including first-year retention rates, 6-year graduation rates, study abroad participation rates, and post-graduation destinations. In the tables that follow, all Wake Forest undergraduate students are considered, including those who complete degrees in the College of Arts and Sciences and those who matriculate to the School of Business after fulfilling core requirements in the College. Additional School of Business metrics are provided below.
First-Year Retention Rate
Because the retention rate measures how many first-year students will return for their second year of school, it provides the College with a valuable tool to determine whether the College is living up to the expectations for student success we set when recruiting students. The first-year retention rate is a well-respected, national best practice gauge of student success. This means not only can we assess internally across various student groups and across time how we are measuring up; we can also track our first-year retention rate against peer and aspirational schools as well. The first year retention rate in the College has consistently been at or above 94% for the most recent cohorts of entering students (2015-2023). The institution aims to maintain a minimum first-year retention rate of 94%, which falls within the range of reported data on first-year retention rates from a select group of IPEDS comparative peer institutions. The institutional goal is to exceed our peer average by reaching 97%.
Table 1. First Year Retention Rate*
| 2015-2017 | 2016-2018 | 2017-2019 | 2018-2020 | 2019-2021 | 2020-2022 | 2021-2023 | |
| Wake Forest College | 95% | 95% | 95% | 94% | 94% | 94% | 94% |
| Peer Average | 95% | 96% | 95% | 95% | 95% | 96% | NA |
*Three-year entering cohort averages; NA, not available as of summer 2025.
6-year Graduation Rates
Even more than the 4-year graduation rate, which offers insight into how many students are finishing their degrees in a timely manner, the 6-year graduation rate measures institutional commitment to ensuring our students complete their education at Wake Forest despite challenges along the way. In addition, the 6-year graduation rate is a nationally recognized metric that helps identify those schools most committed to ensuring the academic success of their student body. It is widely understood that student persistence toward completion of their educational goals is a key gauge of student academic success, and therefore of institutional success as a whole. The 6-year graduation rate for undergraduate students has topped 88% among the most recent cohorts (students entering between 2010-2018). Wake Forest sets a minimum 6-year graduation rate threshold of 87% which falls within the range of reported data on 6-year graduation rates from a select group of IPEDS comparative peer institutions. The peer average of 92% is set as an aspirational goal for 6-year graduation rates.
Table 2. 6-Year Graduation Rate, with Peer Averages*
| 2010-2012 | 2011-2013 | 2012-2014 | 2013-2015 | 2014-2016 | 2015-2017 | 2016-2018 | |
|---|---|---|---|---|---|---|---|
| Wake Forest College | 88% | 88% | 89% | 89% | 90% | 90% | 90% |
| Peer Average | 92% | 92% | 92% | 92% | 92% | 92% | NA |
*Three-year entering cohort averages for all tables; NA, not available as of summer 2025.
Participation in Study Abroad Experience
Study abroad encompasses a constellation of documented high-impact education practices that form the basis of a liberal arts education as valued at Wake Forest. As broadly conceived and carried out, this particular aspect of global learning connects diverse disciplines, cultures, languages, objectives, and pedagogies. By tracking study abroad participation rates, we can evaluate and assess our students’ opportunities for developing the knowledge, skills, and abilities to study, live, and work effectively in cultures other than their own.
From 2014-15 to 2018-19, participation in study abroad at Wake Forest increased 20%, from approximately 61% in 2014-15 to 81% in 2018-19. This 20% increase was double the overall average of leading doctoral universities (10% increase) during the same time period. The COVID-19 pandemic affected participation for the next two cycles with 2020-21 being particularly impacted by pandemic-related travel restrictions and program cancellations. This data point is anticipated to be an outlier as the study abroad rate beginning in 2021-22 exceeds 70% for Wake Forest.
Having improved study abroad participation substantially in the years prior to the COVID-19 pandemic, Wake Forest now aims to have at least 75% of students participating in study abroad with an aspirational goal of over 80% participation.
Table 3. Undergraduate Participation in Study Abroad: Leading Doctoral Universities (Open Doors)
| Academic Year (Fall, Spring, Summer) | Wake Forest | Average |
|---|---|---|
| 2014-15 | 61% | 48% |
| 2015-16 | 63% | 51% |
| 2016-17 | 74% | 52% |
| 2017-18 | 75% | 57% |
| 2018-19 | 81% | 58% |
| 2019-20 | 65% | 39% |
| 2020-21 | 2%* | 6% |
| 2021-22 | 72% | 41% |
| 2022-23 | 83% | 56% |
| 2023-24 | 86%** | Not available–Data to be released November 2025 |
*WFU did not officially submit data to Open Doors due to the pandemic. Internal data were used to determine the percentage of WFU students studying abroad.
** Data are preliminary with official release scheduled for November 2025.
Post-Graduation Outcomes 2017-2024 Bachelor’s Degree Recipients*
In the last eight years, an average of 97% of bachelor’s degree students are either employed or attending graduate or professional schools after graduation. Aside from 2020 (93.7%), the yearly rates meet a minimum expected threshold of 94% and often surpass the goal of 96% in the professional and academic placement of students graduating from the undergraduate programs at Wake Forest.
Table 4. Post-Graduation Outcomes
| 2017 | 2018 | 2019 | 2020 | 2021 | 2022 | 2023 | 2024 | |
| Employed | 67% | 70% | 68% | 61% | 66% | 77% | 65% | 65% |
| Attending graduate or professional school | 30% | 29% | 30% | 32% | 33% | 26% | 32% | 31% |
| Seeking employment | 3% | 2% | 2% | 6% | 1% | 3% | 2% | 3% |
| Not seeking employment | 0% | 0% | 0% | 1% | 0% | 0% | 0% | 1% |
*Data collected by the Office of Personal & Career Development. Data sources include survey data provided by students, LinkedIn profile information and knowledge shared from academic departments and career coaches.
Business
The primary indicators of student achievement within the School include: (1) learning outcomes, (2) employment outcomes, and (3) on-time graduation. Employment outcomes and on-time graduation performance are discussed below.
Employment Outcomes
A key distinction of the School is its significant commitment to students’ career/professional development readiness and employment outcomes. Dedicated Market Readiness and Employment (MRE) staff members exist within each degree program to provide three core services: career coaching, career education and programming, and employer/market connections. The MRE team is an extension of Wake Forest’s Office of Personal and Career Development (OPCD), which is nationally recognized by the leading industry associations (e.g., National Association of Colleges and Employers, National Career Development Association) and various business school ranking organizations (e.g., The Economist, Poets & Quants) for their outstanding thought leadership and career/professional development best practices.
The goal for first destination/employment outcomes for all degree programs is 100%. Employment outcomes for working professional programs (i.e., Charlotte Evening MBA, Winston-Salem Evening MBA, Charlotte Hybrid MBA, online MBA, and online Master of Science in Business Analytics) is typically 100% as these students are employed throughout their degree program experience. Working professional students are advised during orientation that limited career and professional development support is available to working professional students and provided as needed. Thresholds for first destination/employment outcomes are set annually for each degree program in the School, and specific employment outcome targets and timelines are established and routinely monitored to maintain overall market competitiveness.
As is well established, employment outcomes can have a significant effect on business degree rankings. The School has seen consistent success over the years, well-recognized by employers; however, the often-proprietary ways in which the rankings are calculated means that it is difficult, at best, to anticipate from year to year exactly how employment outcomes will impact overall ranking each year. Therefore, the School undertakes an annual effort to use all available information to attempt a reverse engineering of the likely rankings calculations and lets them partially inform the setting of employment outcome goals for the following year. Results are tracked and aligned with staff performance review assessments for MRE staff members. MRE resources represent a significant personnel and financial commitment, for which the School expects to see strong employment/first destination results. Employment outcomes have been encouraging, while continuing to acknowledge any remaining impacts of the pandemic.
The Class of 2025 has shown notable progress in career outcomes, with 73% of graduates securing employment or enrolling in graduate school by graduation – an increase from 69% last year. As of July 2025, 79% of graduates across all programs have achieved successful career outcomes, up from 77% in the previous year. Commitment to supporting students remains steadfast, as the School aims to help those still seeking opportunities secure their paths within six months of graduation (i.e., November).
Table 1. Employment & Graduate School Outcomes at Graduation and 3-Months Post
| 2020 | 2021 | 2022 | 2023 | 2024 | 2025 | |||||||
| Grad | 3-Mo | Grad | 3-Mo | Grad | 3-Mo | Grad | 3-Mo | Grad | 3-Mo | Grad | as of 7/2/2025 | |
| UG | 76% | 91% | 79% | 91% | 81% | 90% | 80% | 99% | 74% | 83% | 77% | 81% |
| MSM | 54% | 68% | 44% | 72% | 66% | 88% | 51% | 73% | 53% | 74% | 55% | 62% |
| MSA | 97% | 98% | 92% | 95% | 97% | 97% | 94% | 97% | 98% | 98% | 98% | 99% |
| MSBA | 37% | 63% | 52% | 84% | 63% | 89% | 33% | 60% | 39% | 66% | 47% | 64% |
Note: Class of 2025 career outcomes are based on NACE standards (employment + graduate school) for all programs. For prior years, undergraduate outcomes were based on First Destination Outcomes (employment, graduate school, non-seeking), and all graduate programs were based on employment only.
Internship Outcomes: 98% of the Undergraduate Business Class of 2024 participated in an internship
Job and internship opportunities have significantly increased over the past year and the last five years, even as the number of graduate schools declined. While the total number of employers and organizations fluctuated year-to-year, the School has experienced a substantial increase over the past five years.
Table 2 – Total # of Employers and Job/Internship Opportunities
| 2024-2025 (current year) | 2023-2024 (last year) | Change from the previous year | 2020-2021 (5 years ago)* | Change from 5 years ago | |
| Total Organizations OCR | 341 | 401 | -15% | 296 | +15% |
| Employers | 215 | 269 | -11% | 151 | +42% |
| Graduate Schools | 126 | 132 | -5% | 145 | -13% |
| Jobs & Internship Postings | 256,864 | 194,196 | +32% | 25,988 | NA |
Note: Job and internship postings for 2020-2021 were significantly affected by COVID.
Retention Rates and On-Time Graduation
Retention rates and on-time graduation represent two additional serious commitments the School of Business makes to students.
The School has a goal of retaining 100% of enrolled students. Retention is defined as follows:
- Undergraduate – A student is defined as retained if he/she stays within the School of Business for the following year.
- Master of Science in Management (MSM) – A student is defined as retained if he/she successfully transitions with his/her matriculation cohort into the third semester of his/her program and attempts the third semester requirements of his/her program.
- Master of Science in Business Analytics (MSBA, on-ground) – A student is defined as retained if he/she successfully transitions with his/her matriculation cohort into the third semester of his/her program and attempts the third semester requirements of his/her program.
- Master of Science in Business Analytics (MSBA, online) – A student is defined as retained if he/she successfully transitions with his/her matriculation cohort from the first year to the second year of his/her program and attempts the second-year requirements of his/her program.
- Master of Science in Accountancy (MSA) – A two-semester MSA student is defined as retained if he/she successfully transitions with his/her matriculation cohort into his/her second semester and attempts the second semester requirements of his/her program. A three-semester MSA student is defined as retained if he/she successfully transitions with his/her matriculation cohort into his/her third semester and attempts the third semester requirements of his/her program.
- Master of Business Administration (MBA, on-ground and online) – A student is defined as retained if he/she successfully transitions with his/her matriculation cohort from the first year to the second year of his/her program and attempts the second-year requirements of his/her program.
Note: Students who take a leave of absence, switch programs, or withdraw and are readmitted are not defined as retained as they have left their matriculation cohort.
The School of Business aims for a 100% retention rate, with an accompanying threshold set at 90%. Active monitoring occurs only if this threshold is not met. Retention rates are generally strong, and any rare instances where thresholds fall short prompt a focused investigation to address specific issues (e.g., Academic Excellence Roadmap Documentation). While recognizing that online programming has its own retention challenges across the graduate education market, the School has chosen to maintain its same standards. To combat these unique challenges, the School provides student-focused resources similar to its on-ground programs; uses business-specific, national ranking metrics for comparison data (e.g., 2025 OMBA Ranking: Graduation & Retention Rates At The Top Online MBA Programs), and meets monthly to review metrics and discuss strategies (e.g., OMBA Working Session). As a result of its concentrated efforts, the School was listed in the 2025 Top 25 Online MBA Programs by Poets & Quants.
Table 3. Retention Rates by Program
| Undergraduate | ||
| Cohort Entry Term | On-Time Grad Term | Retention Rate |
| Fall 2021 | Spring 2023 | 97% |
| Fall 2022 | Spring 2024 | 99% |
| Fall 2023 | Spring 2025 | 98% |
| MS in Management | ||
| Cohort Entry Term | On-Time Grad Term | Retention Rate |
| Summer 2022 | Spring 2023 | 96% |
| Summer 2023 | Spring 2024 | 93% |
| Summer 2024 | Spring 2025 | 95% |
| MS in Business Analytics | ||
| Cohort Entry Term | On-Time Grad Term | Retention Rate |
| Summer 2022 | Spring 2023 | 98% |
| Summer 2023 | Spring 2024 | 99% |
| Summer 2024 | Spring 2025 | 96% |
| MS in Business Analytics (Online) | ||
| Cohort Entry Term | On-Time Grad Term | Retention Rate |
| Summer 2021 | Spring 2023 | 63% |
| Fall 2021 | Summer 2023 | 75% |
| Fall 2022 | Summer 2024 | 67% |
| Fall 2023 | Summer 2025 | TBD |
| MBA (Winston-Salem Evening) | ||
| Cohort Entry Term | On-Time Grad Term | Retention Rate |
| Fall 2021 | Spring 2023 | 94% |
| Fall 2022 | Spring 2024 | 92% |
| Fall 2023 | Spring 2025 | 95% |
| MBA (Charlotte Evening) | ||
| Cohort Entry Term | On-Time Grad Term | Retention Rate |
| Fall 2021 | Spring 2023 | 92% |
| Fall 2022 | Spring 2024 | 87% |
| Fall 2023 | Spring 2025 | 100% |
| MBA (Charlotte Hybrid) | ||
| Cohort Entry Term | On-Time Grad Term | Retention Rate |
| Spring 2022 | Summer 2023 | 79% |
| Spring 2023 | Summer 2024 | 97% |
| Spring 2024 | Summer 2025 | TBD |
| MBA (Online) | ||
| Cohort Entry Term | On-Time Grad Term | Retention Rate |
| Spring 2021 | Spring 2023 | 90% |
| Summer 2021 | Summer 2023 | 86% |
| Fall 2021 | Fall 2023 | 75% |
| Spring 2022 | Spring 2024 | 75% |
| Summer 2022 | Summer 2024 | 71% |
| Fall 2022 | Fall 2024 | 77% |
| Spring 2023 | Spring 2025 | 86% |
| Summer 2023 | Summer 2025 | TBD* |
| Fall 2023 | Fall 2025 | TBD* |
| MS in Accountancy | ||
| Cohort Entry Term | On-Time Grad Term | Retention Rate |
| Fall 2022 (2-semester format) | Spring 2023 | 94% |
| Fall 2022 (3-semester format) | Fall 2023 | 91% |
| Fall 2023 (2-semester format) | Spring 2024 | 94% |
| Fall 2023 (3-semester format) | Fall 2024 | 93% |
| Fall 2024 (2-semester format) | Spring 2025 | 96% |
| Fall 2024 (3-semester format) | Fall 2025 | TBD* |
*Data not available at the time of submission.
Close counseling and tracking of all students across all degree programs contributes to strong on-time graduation performance. On-time graduation is defined as a student who graduates with his/her matriculation cohort at the expected graduation date as outlined by his/her initial program curriculum. Student-initiated delays resulting from changes in major or plan of study are not counted as on-time.
The goal for on-time graduation for all in-person programs is 100%, which is reflective of the strong commitment and investment the School continues to make in student services. The threshold for on-time graduation is 85% for all in-person programs and 60% for online programs, reflecting normal variation due to factors beyond the control or significant influence of the School (e.g., a student electing to take a year’s leave of absence, a student failing a required course late in the degree program such that graduation is delayed).
Overall, the School has consistently achieved its aspirational thresholds for on-time graduation rates, reflecting a commitment to student success. When thresholds are not met, senior leadership collaborates with the relevant associate/assistant dean or academic leader to analyze trends and identify areas for improvement. Interventions may include enhanced academic advising, additional course sections, financial aid counseling, and expanded tutoring services. Policies are also reviewed to address potential barriers, and outcomes are continuously monitored to refine strategies. For example, while the MBA (Charlotte Hybrid) Summer 2023 graduating class did not meet the 80% threshold, achieving 78.9%, targeted efforts led to an improvement with the Spring 2024 cohort reaching a 96.6% on-time graduation rate. Such actions ensure the School maintains and exceeds goals where possible, fostering continuous improvement and student success.
Table 4. Graduation Rates by Program
| Cohort Entry Term | On-Time Grad Term | Entering Cohort Size (# of persons) | On-Time Graduates (# of persons) | Graduation Rate |
| Undergraduate | ||||
| Fall 2021 | Spring 2023 | 346 | 335 | 97% |
| Fall 2022 | Spring 2024 | 282 | 271 | 96% |
| Fall 2023 | Spring 2025 | 302 | 294 | 98% |
| Cohort Entry Term | On-Time Grad Term | Entering Cohort Size (# of persons) | On-Time Graduates (# of persons) | Graduation Rate |
| MS in Management | ||||
| Summer 2022 | Spring 2023 | 95 | 84 | 88% |
| Summer 2023 | Spring 2024 | 83 | 73 | 88% |
| Summer 2024 | Spring 2025 | 81 | 76 | 94% |
| Cohort Entry Term | On-Time Grad Term | Entering Cohort Size (# of persons) | On-Time Graduates (# of persons) | Graduation Rate |
| MS in Business Analytics | ||||
| Summer 2022 | Spring 2023 | 134 | 122 | 91% |
| Summer 2023 | Spring 2024 | 132 | 128 | 97% |
| Summer 2024 | Spring 2025 | 92 | 86 | 93% |
| Cohort Entry Term | On-Time Grad Term | Entering Cohort Size (# of persons) | On-Time Graduates (# of persons) | Graduation Rate |
| MS in Business Analytics (Online) | ||||
| Summer 2021 | Spring 2023 | 8 | 5 | 63% |
| Fall 2021 | Summer 2023 | 4 | 3 | 75% |
| Fall 2022 | Summer 2024 | 9 | 6 | 67% |
| Fall 2023 | Summer 2025 | 16 | TBD* | TBD* |
| Cohort Entry Term | On-Time Grad Term | Entering Cohort Size (# of persons) | On-Time Graduates (# of persons) | Graduation Rate |
| MBA (Winston- Salem Evening) | ||||
| Fall 2021 | Spring 2023 | 46 | 37 | 80% |
| Fall 2022 | Spring 2024 | 38 | 31 | 82% |
| Fall 2023 | Spring 2025 | 37 | 35 | 95% |
| Cohort Entry Term | On-Time Grad Term | Entering Cohort Size (# of persons) | On-Time Graduates (# of persons) | Graduation Rate |
| MBA (Charlotte Evening) | ||||
| Fall 2021 | Spring 2023 | 51 | 43 | 84% |
| Fall 2022 | Spring 2024 | 31 | 27 | 87% |
| Fall 2023 | Spring 2025 | 42 | 40 | 95% |
| Cohort Entry Term | On-Time Grad Term | Entering Cohort Size (# of persons) | On-Time Graduates (# of persons) | Graduation Rate |
| MBA (Charlotte Hybrid) | ||||
| Spring 2022 | Summer 2023 | 19 | 15 | 79% |
| Spring 2023 | Summer 2024 | 29 | 28 | 97% |
| Spring 2024 | Summer 2025 | 30 | TBD* | TBD* |
| Cohort Entry Term | On-Time Grad Term | Entering Cohort Size (# of persons) | On-Time Graduates (# of persons) | Graduation Rate |
| MBA (Online) | ||||
| Spring 2021 | Spring 2023 | 41 | 35 | 85% |
| Summer 2021 | Summer 2023 | 22 | 17 | 77% |
| Fall 2021 | Fall 2023 | 24 | 17 | 71% |
| Spring 2022 | Spring 2024 | 24 | 14 | 58% |
| Summer 2022 | Summer 2024 | 14 | 9 | 64% |
| Fall 2022 | Fall 2024 | 34 | 25 | 74% |
| Spring 2023 | Spring 2025 | 14 | 12 | 86% |
| Cohort Entry Term | On-Time Grad Term | Entering Cohort Size (# of persons) | On-Time Graduates (# of persons) | Graduation Rate |
| MS in Accountancy | ||||
| Fall 2022 (2-semester format) | Spring 2023 | 77 | 72 | 94% |
| Fall 2022 (3-semester format) | Fall 2023 | 42 | 35 | 83% |
| Fall 2023 (2-semester format) | Spring 2024 | 77 | 69 | 90% |
| Fall 2023 (3-semester format) | Fall 2024 | 28 | 25 | 89% |
| Fall 2024 (2-semester format) | Spring 2025 | 79 | 75 | 95% |
| Fall 2024 (3-semester format) | Fall 2025 | TBD* | TBD* | TBD* |
*Data not available at the time of submission
Additionally, on-time graduation performance is monitored at a more granular level (with the same goal/threshold for each subcategory as for the degree program overall). Such measures are chosen based on similar practices within other Wake Forest academic units and at peer/aspirant schools of business, allowing greater comparisons, ultimately toward improvement.
Divinity
Wake Forest University School of Divinity is a graduate, professional school that is Christian by tradition, Baptist in heritage, and ecumenical in outlook. The School of Divinity shares in the University’s commitment to Pro Humanitate through explorations of religious identity, vocation, social responsibility, and public engagement.
The School uses multiple measures to document student success, including graduation rates, placement rates, and responses to a graduating student questionnaire, as outlined below. These measures apply to on-campus (MDiv) and online (DMin) programs. Some of those measures are related to accrediting standards established by The Association of Theological Schools (ATS), the accrediting body for graduate theological institutions and related annual reports. The ATS Standards of Accreditation also require that institutions identify, assess, and publish goals and outcomes for student achievement.
The School submits to ATS and subsequently receives graduation and placement data through an annual Strategic Information Report (SIR) compiled and shared by ATS with member schools. The information compiled in the SIR is based on data reported by each school through the ATS Annual Report process. The SIR details graduation and placement rates for the previous 10 years.
Graduation Rates
As a measure of program success, the Divinity School tracks graduation rates. Because the three-year Doctor of Ministry Program commenced in Fall 2024, there is no graduation rate data available for this program.
Graduation Rate Threshold and Goal
The Divinity School’s Master of Divinity graduation rate threshold is 80% of students graduating within 3-4 years of matriculation. The Divinity School’s Master of Divinity graduation rate goal is 85% of students graduating between 3 to 4 years of matriculation. The Divinity School aims for this graduation rate over a consistent, 3-year average period. This percentage shows the School of Divinity’s desire to graduate as many students as possible while reflecting certain realities amongst our students. For example, each year, a few MDiv students withdraw or take a leave of absence for personal reasons, or they transfer to another theological school. A few MDiv students become academically ineligible (fewer than 5% per year). The 3-4 year time frame of this goal aligns with the School’s related aim of reducing student debt. Further, a small percentage of students (5-10%) are accepted into one of the School’s combination degree programs, with the result that they will graduate from both programs in a total of about four or five years.
Over the past 10 years, the majority of students (92.7%) have completed the Master of Divinity degree within 3 to 4 years (or 6 to 8 semesters).
The most recent 3-year period had an average 3-4 year graduation rate of 76.7%, as seen in Table 1.
Table 1. Master of Divinity Students 3-4 year Graduation Rates
| Year of Matriculation | Number of Students Enrolled | Number of Students who Graduated in 3-4 Years | Graduation Rate |
| 2020 | 30 | 20 | 67% |
| 2021 | 24 | 22 | 92% |
| 2022 | 21 | 14 | 71% |
| Average | 77% |
Improving Graduation Rates
The School continues its efforts to improve graduation rates among all students.
The Divinity School supports students to complete their degrees within 3 to 4 years by encouraging full-time enrollment status and designing the degree program so that most students can graduate within that time frame. The School initiated and implemented a renewed MDiv curriculum in Fall 2024 that reduced the overall credit hours from 76 to 72 and streamlined the program’s requirements giving students greater access to and flexibility in course offerings, thereby increasing the likelihood that students can complete the degree within 3 to 4 years by taking 12 credit hours per semester.
The School implemented the Wake Div Promise in 2023, a program offering full-tuition scholarships to all full-time students in the MDiv program. The majority of MDiv students are employed part- or full-time while enrolled in the MDiv program. These MDiv students often enroll in fewer credit hours per semester and sometimes take time off from their studies due to employment obligations. Some MDiv students who leave the program cite financial reasons. The full-tuition model helps alleviate some issues related to employment and financial security while enrolled in the MDiv program.
Additionally, the School of Divinity created an action plan to identify reasons for and address recent dips in overall graduation rates. The School identified the following main reasons for the dip in graduation rates: personal issues related to the COVID-19 pandemic, other familial/personal reasons, and financial distress. Based on a review of the students who left the program or who were not able to graduate within 3-4 years, the School views the decreased numbers as a “dip” rather than a trend. The following action steps were created to be implemented starting in Spring and Fall 2025:
- The Office of Academic Affairs and Office of Admissions and Student Services will meet jointly twice a year to update and review retention data. A report will go to the Dean for review and recommendation.
- Due to retention data review showing that students leave our program for financial reasons, the Office of Admissions and Students services will continue to update and review financial wellbeing resources. In 2023, this Office implemented a virtual pre-orientation for MDiv students that includes a financial wellbeing module. In Spring 2025, the Office added a new virtual session for incoming students called “The Cost of Your Call: How to Fund your Theological Education with Creativity and Confidence” to be offered each semester.
- The Office of Admissions and Student Services will continue to promote the use of the Wellbeing Watch form so that students’ personal, financial, and academic struggles can be addressed. This form was created and implemented in Fall 2024. Faculty, staff, and students can easily submit concerns about their students or peers.
- The Office of Admissions and Student Services will schedule regular outreach to students who have stopped the program or taken a leave of absence to help determine barriers to finishing the degree and find creative solutions to help students to that end.
Placement Rates
The School of Divinity also assesses program outcomes, particularly those related to the University’s Mission of “applying and using knowledge in the service of humanity” by monitoring career placement statistics. The changing nature of ministry and religious leadership means that students are finding ways to apply their theological education not only in traditional congregational and chaplaincy settings, but also in a broad range of other ministry contexts. As of November 2024, students from May 2024 MDiv graduating class were are working in the following areas: congregational ministry (30%), chaplaincy (9%), non-profit work (13%), education/higher education (18%), counseling (13%), and other fields (9%).
The Divinity School’s 6-month post-graduation placement rate threshold is 85%. This threshold is based on our average placement rate since 2015 and on our typical student vocational goals post graduation. A small percentage of students each year fall in the category of what ATS calls a “non-vocational placement.” This category includes graduates who enter the program for non-vocational reasons, such as for personal enrichment. For example, we have had retirees, attorneys, higher education professionals, teachers, etc. who completed the program but remain in their previous status (retirement) or job. A small percentage of graduates also choose to go on to further study rather than seek a vocational placement.
Our goal for 6-month post-graduation placement is 95% and is set by the average placement rate over the past 10 years (Figure 4-4a, Percent of Positive Placements, 2024 ATS SIR ) and in consultation with our Director of the Art of Ministry program. This number reflects our desire for all of our students who seek a vocational placement to gain one while keeping in mind that we have students who will not be seeking placement.
Figure 4-4a – Percent of Positive Placements MDiv
Of our May 2024 graduates, six months post-graduation (in November 2024), 82% were employed in a vocational placement, 5% were engaged in further study, 9% were seeking placement, and 5% were “unknown”. According to ATS, positive placements include those engaged in further study; thus, the School of Divinity has a total positive placement rate of 87% for 2024.
Table 2 shows placement rate data by degree compared with all ATS schools. This data indicates that students meet hiring standards and educational requirements of potential employers in ministry contexts and are competitive as applicants for additional education beyond the MDiv and for diverse ministry jobs.
Table 2. WFU and All ATS Schools Placement Rates
| Year | WFU School of Divinity Placement Rates | All ATS Schools Placement Rates |
| 2021 | 100% | 91% |
| 2022 | 95% | 91% |
| 2023 | 90% | 90% |
| 2024 | 87% | 91% |
Indirect Measures of Student Achievement
Demographic and program satisfaction data for each graduating class in Doctor of Ministry and Master of Divinity degree programs is collected each academic year through the Graduating Student Questionnaire (GSQ), which is administered through ATS. The GSQ provides information about student satisfaction with the degree program, debt load upon graduation, and job placement. The GSQ is self-reported by graduating students using a survey asking students to rate their evaluation on the following 1 – 5 scale: 1 – Not at all effective; 2 – Not very effective; 3 – Somewhat effective; 4 – Effective; 5 – Very effective
Coupled with placement data (above), the GSQ provides the Divinity School with a useful picture of program effectiveness and student achievement. The Divinity School had a 100% GSQ participation rate for 2024-25, a 92% participation rate for 2023-24; a 83% participation rate for 2022-23; and a 85% participation rate for the year 2021-22.
The MDiv program is designed to equip graduates to be effective religious leaders and to cultivate personal and professional growth. The Divinity School expects that students will experience the MDiv curriculum as “somewhat” to “very effective” in equipping them to lead in diverse ministry settings so the GSQ threshold is set at the middle of the self-reported scale (an average of at least 3 on each of the tables below). This threshold is based on the diverse vocational goals students bring into the program and the breadth of course offerings available to students. In 2024 – 2025, the Divinity School met this GSQ threshold in all of the 36 areas assessed, and all areas show a consistent trend of marked improvement over the past four years. The School’s GSQ goal is an average of 4 on the self-reported scale in each of the areas surveyed. To advance toward this goal, and in cases where the School does not meet the GSQ threshold, faculty explore curricular adjustments to improve effectiveness. Examples include enhancing existing courses and offering additional courses in particular curricular areas where the average scores are lower than the threshold.
Table 3. Measure of Educational Effectiveness and Personal Growth
| Area of Personal Growth | 2025 | 2024 | 2023 | 2022 |
| Empathy for the poor and oppressed | 4.9 | 4.6 | 4.3 | 4.5 |
| Ability to pray | 3.6 | 3.1 | 2.8 | 3.1 |
| Concern about social justice | 4.9 | 4.7 | 4.1 | 4.5 |
| Enthusiasm for learning | 4.5 | 4.1 | 3.8 | 3.8 |
| Insight into troubles of others | 4.7 | 4.4 | 4.0 | 4.4 |
| Desire to become an authority in my field | 4.3 | 3.7 | 3.7 | 3.3 |
| Trust in God | 3.9 | 3.4 | 3.3 | 3.1 |
| Self-discipline and focus | 4.0 | 3.3 | 3.7 | 3.2 |
| Respect for other religious traditions | 4.6 | 4.6 | 4.2 | 4.0 |
| Respect for my own religious tradition | 4.3 | 4.1 | 3.9 | 3.8 |
| Ability to live my faith in daily life | 4.3 | 3.7 | 3.3 | 3.3 |
| Clarity of vocational goals | 4.5 | 3.8 | 3.6 | 3.1 |
| Self-confidence | 4.6 | 4.3 | 3.4 | 3.6 |
| Self-knowledge | 4.6 | 4.4 | 3.8 | 3.8 |
| Strength of spiritual life | 4.3 | 3.4 | 3.1 | 3.5 |
Table 4: Educational Effectiveness in Facilitating Skill Areas
| Skill Area | 2025 | 2024 | 2023 | 2022 |
| Ability to preach well | 4.0 | 3.5 | 3.2 | 3.2 |
| Ability to use and interpret Scripture | 4.6 | 4.7 | 4.2 | 4.2 |
| Knowledge of church polity/canon law | 3.5 | 3.1 | 2.6 | 3.1 |
| Ability to give spiritual direction | 3.7 | 3.4 | 2.8 | 3.3 |
| Ability to teach well | 3.8 | 3.4 | 3.3 | 3.3 |
| Knowledge of church doctrine and history | 4.2 | 4.3 | 3.7 | 3.8 |
| Ability to lead others | 4.0 | 3.9 | 3.7 | 3.8 |
| Ability to conduct worship/liturgy | 4.2 | 4.1 | 3.8 | 3.8 |
| Ability to interact effectively with those of religious traditions other than my own | 4.6 | 4.5 | 4.2 | 4.1 |
| Ability to work effectively within my own religious tradition | 4.6 | 4.1 | 3.5 | 3.5 |
| Ability to interact effectively with those from cultural and racial/ethnic contexts other than my own | 4.7 | 4.6 | 4.1 | 4.2 |
| Awareness and appreciation of the globalized context in which ministry is practiced | 4.8 | 4.6 | 3.9 | 4.3 |
| Ability to work effectively with both women and men | 4.8 | 4.4 | 4.1 | 4.5 |
| Ability to relate social issues to faith | 4.9 | 4.8 | 4.3 | 4.8 |
| Ability in pastoral counseling | 4.2 | 3.4 | 3.0 | 3.6 |
| Ability to administer a parish/congregation | 3.6 | 2.9 | 2.7 | 3.1 |
| Knowledge of Christian ethics | 4.1 | 3.9 | 3.6 | 3.8 |
| Ability to think theologically | 4.7 | 4.7 | 4.5 | 4.3 |
| Ability to integrate insights from science into theology and ministry | 4.2 | 3.8 | 3.6 | 3.6 |
| Ability to integrate ecological concerns into theology and ministry | 4.6 | 4.4 | 4.2 | 4.4 |
| Knowledge of Christian philosophy | 4.2 | 3.7 | 3.5 | 3.9 |
Graduate School
Arts and Sciences — Reynolda Campus
The Graduate School of Arts and Sciences identifies, evaluates, and publishes its goals and outcomes for student achievement.
Graduate School of Arts and Sciences uses three key metrics to document student success. While individual programs may have various and disparate goals for student success, the Graduate School of Arts and Sciences considers the following three metrics of student success across all graduate programs.
The Graduate School (Arts & Sciences) aims for its graduating students to exceed the Student Learning Objectives (SLOs) established by each individual program.
Each program identifies expected student learning outcomes by setting at least three learning objectives for its graduating students. Each program evaluates the extent to which it achieves these goals as follows. At the time of graduation, each student is rated by the mentor and/or director of the graduate program across each learning objective with one of the following scores: 1-does not meet expectations; 2-meets expectations; 3-exceeds expectations. Two programs (Interpreting and Translation Studies, Education) use a 5-point scale where 3 is equivalent to meets expectations. These 5-point scales provide these two programs with more useful and actionable information within the context of their programs and SLOs and, for comparison purposes, the average scores for these programs are converted to the 3-point scale in the table below. The minimum threshold for each program is an average of 2.00 (meets expectations). These scores are based upon historical practices. “Meets Expectations” is the minimum historical standard for “pass” for a thesis or dissertation defense evaluation. The minimum threshold is therefore a score of 2, i.e., all students would successfully complete the degree. The aspirational goal, of course, is that all students exceed expectations (average score 3.0). These data are tabulated below.
Table 1. Performance on Student Learning Outcomes
| Program | Number of Learning Objectives | Total 2023 Graduates | Average SLO Score 2023 | Total 2024 Graduates | Avg. SLO Score 2024 | Total 2025 Graduates | Average SLO Score 2025 |
| Bioethics | 4 | 4 | 2.80 | 10 | 2.73 | 9 | 2.79 |
| Biology | 4 | 11 | 3.00 | 8 | 2.53 | 20 | 2.40 |
| Chemistry | 5 | 11 | 2.73 | 4 | 2.73 | 19 | 2.20 |
| Communication | 3 | 10 | 2.77 | 9 | 2.01 | 4 | 2.43 |
| Computer Science | 3 | 6 | 2.55 | 4 | 2.55 | 4 | 2.40 |
| Counseling | 3 | 112 | 2.71 | 112 | 2.84 | 142 | 2.74 |
| Documentary Film | 8 | 10 | 2.20 | 11 | 2.22 | 10 | 2.49 |
| Education | 5 | 11 | 2.83 | 15 | 2.69 | 8 | 2.82 |
| English | 3 | 8 | 2.33 | 7 | 2.48 | 6 | 2.57 |
| Health and Exercise Science | 4 | 5 | 2.23 | 6 | 2.20 | 6 | 2.42 |
| Interpreting and Translation Studies | 3 | 11 | 2.62 | 5 | 2.65 | 7 | 2.88 |
| Liberal Arts Studies | 4 | 24 | 2.73 | 11 | 2.65 | NA | NA |
| Mathematics | 5 | 9 | 2.40 | 6 | 2.46 | 13 | 2.72 |
| Physics | 4 | 5 | 3.00 | 5 | 2.86 | 3 | 2.68 |
| Psychology | 5 | 5 | 2.30 | 10 | 2.75 | 14 | 2.60 |
| Statistics | 5 | 6 | 2.30 | 9 | 2.75 | 15 | 2.78 |
| Sustainability | 5 | 23 | 2.69 | 15 | 2.57 | 7 | 2.86 |
| Graduate School of Arts and Sciences | 73 | 271 | 2.60 | 247 | 2.55 | 287 | 2.61 |
All programs met this 2.0 threshold in the Academic Years 2023, 2024, and 2025. The average performance for all students in the Graduate School of Arts and Sciences is given in the bottom row and has remained consistent (2.55-2.61) for the past three years. The average score for 271 graduating students was 2.60 in 2023. In 2024, the average score for 247 graduating students remained essentially the same at 2.55. In 2025, the average score for 287 graduating students was 2.61.
The Graduate School of Arts and Sciences sets a goal that less than 10% of its graduating students will have undecided career paths upon graduation.
While 100% of students with career paths related to their graduate work is the goal, the identified outcome for student achievement of 90% is a more realistic and attainable minimum threshold. It can reasonably be expected that some students will change their focus during or after graduate school each year.
The Graduate School of Arts and Sciences evaluates the extent to which it meets this goal by tracking the specific placement of recent graduates. There are 4 categories: (1) Pursued Advanced Degree; (2) Entered the Workforce; (3) Began a Teaching Position; and (4) Undecided. Those results from the past 10 years are tabulated below.
Table 2. Graduation Placement
| Graduation Year | % Advanced Degree | % Workforce | % Teaching | % Undecided |
| 2025 | 19 | 65 | 5 | 11 |
| 2024 | 15 | 67 | 7 | 11 |
| 2023 | 13 | 67 | 8 | 13 |
| 2022 | 35 | 50 | 7 | 8 |
| 2021 | 35 | 48 | 8 | 12 |
| 2020 | 39 | 48 | 7 | 7 |
| 2019 | 42 | 44 | 7 | 7 |
| 2018 | 40 | 44 | 13 | 4 |
| 2017 | 46 | 35 | 16 | 3 |
| 2016 | 35 | 40 | 15 | 10 |
| 2015 | 54 | 25 | 18 | 3 |
Note that Pursuing an Advanced degree refers to students going on to Masters, PhD, or JD programs, Entering the Workforce Directly means pursuing an opportunity in the private sector or a post-doc, and Going Into Teaching means pursuing a career in K-12 education/higher education.
Only 11% of Wake Forest graduates had unknown career paths upon graduation in 2025. From 2015 to the present, one may argue that the graduates are slowly transitioning from mostly “Pursuing an Advanced Degree” to “Entering the Workforce Directly,” or that the fraction “Going Into Teaching” is shrinking, or that there is a minor upward trend evident in the % Undecided data. The Graduate School of Arts and Sciences is monitoring the trends in these data. At present, given the challenges faced by graduates during and after the COVID pandemic and the current crises in higher education, it is not surprising to see the number of students undecided on their career path being slightly over the goal of 10%. At the present time, the Graduate School of Arts and Sciences does not believe the data in % Undecided is actionable. We will continue to monitor these data and communicate with Graduate Program Directors to ensure graduate students are aware of all potential career paths.
The Graduate School of Arts and Sciences sets a goal that 100% of its master’s students complete the degree in 2 years, and 100% of its doctoral students complete the degree in no more than 7 years.
The Graduate School of Art and Sciences has identified a minimum threshold for its graduates to complete their degree faster than the national average. The Council of Graduate Schools (CGS) includes almost all graduate schools in the United States. It published a survey in 2013 entitled “Completion and Attrition in STEM Master’s Programs” which includes data for mathematics, computer science, physical, behavioral and social sciences. That work reported national average 2-year completion rates for the M.A. as 45%, and the M.S. as 40%. The data were also disaggregated by gender and race/ethnicity. A similar survey published in 2007 “A Data-Driven Approach to Improving Doctoral Completion” reported the national average 10-year completion rate for the Ph.D. as 54.7%. A recent web search shows that time to degree completion for MA/MS (2-3 years) and PhD (5.8-7.5) have not changed appreciably over time. Similarly the estimated average 2-Year completion rates for MA/MS programs for full-time students is ~40–50% complete within 2 years. The estimated average 7-Year completion rates for PhD programs for full-time students is ~50–60% complete within 7 years (Bio-55-60%, Chem & Physics-60-70%). Based on this nationwide data, the Graduate School adopted these as minimum thresholds of success for all students regardless of gender, race, or ethnicity.
The Graduate School of Arts and Sciences evaluated the extent to which it met this goal by comparing its completion rates to the CGS rates. The 2024 master’s graduates would have entered in 2022, and the 2025 graduates in 2023, while the Ph.D. graduates would have entered in 2017 and 2018. For the Ph.D., Wake Forest reports the 7-year completion rate rather than the 10-year rate reported by CGS. Note that in every case reported by CGS, Wake Forest exceeds the completion rate reported by CGS except for the Ph.D. rate. However, it is important to note that the 7-year rate at Wake Forest is comparable to the CGS rate which took 3 extra years to achieve. By any measure, the WFU completion rates for Masters and Doctoral programs far exceeds the national averages.
Table 3. Completion Rates
| 2024 WFU Graduates | 2025 WFU Graduates | CGS Data | |
| % Completed | % Completed | % Completed | |
| Degree | |||
| Ph.D. | 89 | 52 | 55 |
| M.A. | 98 | 90 | 45 |
| M.S. | 97 | 95 | 40 |
Biomedical Sciences — Bowman Gray Campus
The Biomedical Science programs of the Graduate School evaluate and refine their success metric goals as a part of their annual reporting process each summer. The success metrics have been published, with initial thresholds set based on an analysis of prior data, and goals set to encourage programs to deliberately monitor the academic progress of their enrolled students. These metrics and their thresholds have been monitored annually, with thresholds and goals modified during the annual reporting process. Data related to these metrics are available in Annual Report Tables which may be requested from the Biomedical Programs Office.
The Biomedical Graduate Programs at Wake Forest University School of Medicine are steadfast in their mission “to train and mentor future leaders in research, teaching, and innovation in service to humanity.” This mission is intricately tied to Wake Forest University’s overarching mission, “Wake Forest is a university dedicated to the pursuit of excellence in the liberal arts and in graduate and professional education.” The alignment of these missions underscores a unified commitment to academic rigor, professional development, interdisciplinary learning, and societal contribution. As one of the engines of creativity and innovation of Wake Forest University, the Biomedical Graduate Programs contribute to the academic reputation of the University by educating the next generation of teachers and scholars and by providing mentors and role models for educating undergraduates.
Key data concerning the Biomedical Graduate Programs highlights metrics related to four distinct measures of student success that the Biomedical Science programs of the Graduate School are focused on. The following are addressed in detail in the student success section below:
- The rates of graduating students completing their degrees on-time, as defined by the student’s plan of study
- The rates of current students maintaining satisfactory academic progress
- The percentages of graduated students reporting career readiness
- The percentages of graduated students meeting publication productivity goals
For the Biomedical Graduate Programs, our office combines all doctoral (PhD) degree programs and all master (MS and MHL) programs into pools due to the small sample size of graduated students in individual programs in a given academic year.
Student Success
On-time degree completion
Each program has a plan of study that defines the required coursework and, in many cases, the expected time-to-degree. While dissertation and thesis-based programs have some variability in the amount of time that is required to collect an adequate amount of research productivity that may result in a final document, we are able to set an expectation for each biomedical graduate program. Time-to-degree is a key attribute of graduate programs and is considered an indicator of graduate program efficiency. Monitoring on-time completion allows the Biomedical Graduate Program office to identify and manage issues within our programs.
For doctoral-level programs, our threshold is for 65% of all doctoral students to complete their degree within 5.1 years, with the goal that 75% of doctoral students will achieve this milestone within the same timeframe. The 65% benchmark was determined based on an analysis of historical data from Wake Forest University’s biomedical graduate program graduates, acknowledging the likelihood that this percentage goal will increase as graduate programs strive toward the new target. Data compiled in the National Research Council’s (NRC) report revealed median values of 5.06 (Biomedical Engineering) to 5.73 (Genetics and Genomics) years, with other discipline areas offered by the Graduate School of Biomedical Sciences falling somewhere between those two values. 5.1 years was selected as the on-time threshold in recognition of our own prior date, and the stated desire by our programs to have a value lower than that reported in the NRC’s report. Disaggregated sub-populations (females and under-represented minorities) are held to the same threshold and goal expectation.
For master-level programs, the threshold is for 80% of all master’s students to complete their degree by the designated benchmark based on the student’s plan of study. The goal is for 90% of master’s students to achieve this milestone by the appropriate benchmark based on their plan of study. The benchmarks for plan of study are as follows:
- 2.1 years for thesis-based students
- 1.8 years for students on a 5-term plan of study
- 1.5 years for students on a 4-term plan of study
- 1.1 years for students on a 3-term plan of study
On-time degree completion rates have recently been lower than the established threshold for doctoral programs, although the goal was met for master’s programs. Internal reviews were conducted with individual program directors. The 2023 doctoral class was clearly impacted by the slowing of research during COVID and reflected the closure of laboratories for a time while research mentors explored and implemented strategies to restore labs to a functional state. This trend is expected to continue into the 2024 and 2025 doctoral classes. However, more recent data indicates that the threshold is being met once again (see Table 1). There is also a noticeable upward trajectory back towards the established goal. Programs with a larger percentage of students finishing in greater than 5.1 years have been notified, and those programs are responsible for reviewing their monitoring of academic progress.
Review of sub-population data shows that:
a) all MS sub-populations are exceeding our goals and
b) that the female sub-population for PhD graduates is meeting our threshold.
Table 1. On Time Degree Completion Across Academic Years for All Graduating Students
| Class Graduation Year | On Time Degree Completion Rate- Masters | On Time Degree Completion Rate- Doctoral |
| 2020-2021 | 85% | 76% |
| 2021-2022 | 74% | 68% |
| 2022-2023 | 91% | 68% |
| 2023-2024 | 91% | 57% |
| 2024-2025 | 90% | 65% |
Table 2. On Time Degree Completion Across Academic Years for Graduating Female Students
| Class Graduation Year | On Time Degree Completion Rate – Master | On Time Degree Completion Rate – Doctoral |
| 2020-2021 | 86% | 75% |
| 2021-2022 | 65% | 44% |
| 2022-2023 | 92% | 56% |
| 2023-2024 | 93% | 57% |
| 2024-2025 | 93% | 65% |
Satisfactory academic progress rate
All programs are held to similar standards with regard to satisfactory academic progress, with common definitions for student progress that is deemed unsatisfactory, using the following classifications:
- At-risk for graduation: Any student with a cumulative GPA between 2.5 and 3.0 at the end of an academic term;
- Academic probation: Any student with a cumulative GPA below 2.5 at the end of an academic term, or that receives an “Unsatisfactory” grade in Thesis/Dissertation Research, Capstone Project, or Internship.
Students that are in either status are ineligible for graduation, may become ineligible to access federal financial aid, and require more academic advising to re-establish satisfactory academic progress. Monitoring the rates of satisfactory academic progress in each program allows the Biomedical Graduate Program Office to identify and manage student advising issues within our programs.
For doctoral-level programs, our threshold is for 95% of all doctoral students to maintain satisfactory academic progress within a given academic year. Our goal is for 98% of our doctoral students to maintain satisfactory academic progress over the same time period. The 95% threshold was selected based on a review of data from prior year, with a recognition of the probability that the percentage goal will likely increase as graduate programs seek to drive towards the new goal.
For master-level programs, our threshold is for 95% of all master’s students to maintain satisfactory academic progress within a given academic year. Our goal is for 98% of our master’s students to maintain satisfactory academic progress over the same time period. The 95% threshold was selected based on a review of data from prior year, with a recognition of the probability that the percentage goal will likely increase as graduate programs seek to drive towards the new goal.
Satisfactory academic progress rates for the aggregated biomedical graduate programs are currently meeting established thresholds and, for doctoral students, are achieving program goals. Internal reviews are held with program directors during a standing program director’s meeting each year following the compilation of updated data. In the case that an individual program’s satisfactory academic progress rates were not at the expected threshold, the Biomedical Graduate Programs office shares the program’s individual data with that program director for the program’s review and the program is charged with seeking to address the issue. That said, for the 24-25 academic year, with the exception of one program, no program had more than one student placed on academic probation for the year.
Career readiness ratings
Embedded within the Exit Survey for Biomedical Graduate Programs, each graduated student rates, on a 5-point scale, their preparedness for a career on two items:
- Start a Career in My Chosen Field
- Apply Graduate Training to My Next Environment
As there is a stated concern to assure that Wake Forest’s biomedical programs are producing graduates that are job ready on day 1, there is an expectation that graduate students should report a high degree of preparedness. Monitoring these two career readiness ratings allows the Biomedical Graduate Program Office to identify and manage issues within our programs.
For all programs, our threshold is for the average rating for all graduating student to be:
- 3.8 (out of 5) for “career readiness”
- 4.2 (out of 5) for “apply graduate training in next environments”
For all programs, our goal is for the average rating for all graduating student to be:
- 4.0 (out of 5) for “career readiness”
- 4.4 (out of 5) for “apply graduate training in next environments”
The percentage of respondents reporting career readiness in the aggregated programs has met the established threshold. This marks the third consecutive year that this metric has reached the threshold. All programs will continue to monitor their exit survey data to maintain this outcome.
Publication productivity
Each dissertation and thesis student is required to prepare a publication quality product in order to successfully complete a final defense. A count of peer-reviewed publications is deemed a key success metric for research-based graduate programs and is considered an indicator of a graduate program’s productivity. Monitoring peer-reviewed publications allows us to identify and manage issues within our dissertation and thesis programs.
For doctoral-level programs, our threshold is for 75% of all doctoral students to have at least one peer-reviewed publication in press or in print by the time of graduation AND have at least 2 additional publications projected within 3 years of graduation. Our goal is 90% for the same criteria. The 75% threshold was selected based on a review of data from prior year, with a recognition of the probability that the percentage goal will likely increase as graduate programs seek to drive towards the new goal.
For students in master-level programs that require a thesis, our threshold is for 60% of all master students to have at least 1 publication in press OR in print by the time of graduation, or 1 publication projected within 3 years of graduation. Our goal is 75% for the same criteria. The 60% threshold was selected based on a review of data from prior year, with a recognition of the probability that the percentage goal will likely increase as graduate programs seek to drive towards the new goal.
Table 3 indicates that our doctoral candidates have exceeded the established threshold and achieved the target for publication productivity.
Table 3. Percentage of Biomedical PhD Graduates Meeting Publication Productivity Expectations by Academic Year with Sub-population breakdowns
| Academic Year | All |
| 2022-2023 | 86% |
| 2023-2024 | 92% |
| 2024-2025 | 90% |
Table 4 indicates that the proportion of students in our master’s programs who meet or surpass the established publication productivity criteria aligns with the benchmark set for all participants.
Table 4. Percentage of Biomedical MS Graduates Meeting Publication Productivity Expectations by Academic Year with Sub-population breakdowns
| Academic Year | All |
| 2022-2023 | 73% |
| 2023-2024 | 89% |
| 2024-2025 | 69% |
Law
The Law School confers four degrees: Juris Doctor (JD), Master of Laws (LLM), Doctor of Judicial Science (SJD), and Master of Studies in Law (MSL). The most fundamental measure of student achievement in all four programs is the graduation rate. Each program also has indicators of achievement particular to the program.
Measures of Student Achievement in the Juris Doctor Degree
In the JD program, the Law School evaluates student achievement through four indicators: (1) student retention, as measured by attrition rates; (2) graduation rate; (3) bar examination passage rate; and (4) post-graduation employment outcomes.
Student Retention through Academic Eligibility
Some JD students leave the program to pursue other career opportunities, for personal reasons, or because they transfer for a different law school. In terms of measuring student success, the Law School is primarily concerned with JD students who leave the program because they become academically ineligible. Students in the JD program become academically ineligible to continue if they fail to achieve a weighted grade average of 2.33 at the end of the first year of the program and at the end of every academic semester thereafter.
The Law School has several interventions designed to identify students who are struggling in the JD program early in their first year, and to support those students throughout their time at the law school. At the end of the fall semester of the first year, the students in the bottom percentage of the class are required to take a one-credit course, Critical Academic Skills Enhancement (CASE). The course was designed to help students develop the skills to succeed in law school and lay the foundation for success on the bar exam. In addition, students who are identified as academically struggling are referred to the Assistant Dean for Academic Affairs and the Director of Academic Excellence and Bar Support for individualized academic advising. Very few students in the JD program are declared academically ineligible to continue in the program.
The Law School has adopted a student retention threshold, which is outlined in Table 1 below.
Table 1. Juris Doctor Student Retention Threshold and Goal

The Law School has established a student retention threshold of less than 5% academic attrition per JD cohort (first year/upper level), with a goal academic attrition of less than 2% per cohort. These benchmarks were developed through historical analysis of attrition data, evaluation of the effectiveness of academic support programs, and alignment with peer institutional practices and ABA reporting expectations. The chosen threshold represents a level at which academic attrition is considered a potential indicator of systemic concern, prompting further review. The more aspirational goal of less than 2% reflects the Law School’s commitment to early intervention and individualized academic support aimed at promoting student success and persistence. The Law School has adopted the threshold and goal by cohort (first year students, upper level students) since the historical academic attrition is highest after the first year in the Juris Doctor program.
As demonstrated in Table 2 below, the Law School has met both the threshold and goal for both the first year cohort and upper level cohort of students each of the past five academic years.
Table 2. Juris Student Retention as Reported by Academic Attrition

The low levels of academic attrition historically observed at the Law School—combined with targeted programs such as the Critical Academic Skills Enhancement (CASE) course, individualized academic advising, and early identification of at-risk students—demonstrate the institution’s intentional strategy to minimize academic ineligibility while maintaining rigorous academic standards. These interventions reflect the Law School’s broader commitment to excellence, student support, and mission-driven outcomes, and serve as a key measure in the assessment of student achievement.
Graduation Rate
The JD program is designed as a full-time, day-program typically completed in three academic years. According to the Student Handbook, students must complete all graduation requirements within five academic years from the date of matriculation. In rare cases, students may apply and be approved to graduate after five semesters (fall and spring) if they meet all academic and credit hour requirements.
To assess program effectiveness and student achievement, the Law School monitors time-to-degree completion rates and has established a threshold and goal for JD graduation rates, which can be found in Table 3.
Table 3. Juris Doctor Graduation Rate Threshold and Goal

These benchmarks were developed through a collaborative process involving faculty, academic affairs leadership, and a review of historical data. The 90% threshold reflects a conservative lower boundary based on historic performance and peer comparisons. The five-year time frame for the threshold mirrors the JD degree maximum degree length. The 95% graduate rate within three years goal represents our commitment to student achievement and institutional effectiveness. A three-year time frame for the goal was selected because it aligns with the normative path for full-time JD students and enables early detection of academic or support deficiencies. Both benchmarks are consistent with student expectations and accreditation principles that stress timely program completion as a meaningful indicator of student success.
The Law School proactively supports timely graduation through the following mechanisms:
- Course Access and Scheduling: The Senior Associate Dean and Assistant Dean for Academic Affairs strategically plan course offerings to ensure availability of required and high-demand electives, enabling all students to meet graduation requirements in a timely manner.
- Faculty Advising: Each student is assigned a faculty academic advisor. Faculty are encouraged to initiate regular communication and to offer tailored academic planning prior to registration each semester.
- Degree Progress Tracking: The Workday Student platform provides students with a real-time academic progress audit, ensuring they can independently verify completion of graduation requirements.
- Academic Support and Early Intervention: Students in the bottom percentile of the class after the first semester are required to enroll in Critical Academic Skills Enhancement (CASE), a one-credit course focused on study strategies and legal reasoning. Individualized academic support is also offered by the Director of Academic Excellence and Bar Support.
The Law School closely monitors graduation outcomes by cohort. If the graduation rate falls below the threshold for any cohort, a formal review is conducted by the Academic Affairs team in consultation with the Curriculum Committee. This includes:
- Identifying common causes for delayed graduation (e.g., leaves of absence, academic standing issues, course availability)
- Implementing corrective measures such as curricular changes, advisor training, or enhanced academic support
- Setting short-term remediation goals and conducting follow-up assessments in the next academic year
This approach ensures that our graduation outcomes remain not only compliant but also aligned with our institutional mission of fostering professional achievement and timely career entry for our students.
The following tables reflect JD graduation rates for the most recent three graduating classes. The graduation rates in the table are based on three years after matriculation, tracking goal performance.
Table 4. Juris Doctor Graduation Rates Three Years from Matriculation, Graduating Classes 2023 – 2025
| Juris Doctor | Total Matriculants | Total Grads | |
| # | % | ||
| Class of 2023 | 88 | 85 | 97% |
| Class of 2024 | 167 | 156 | 93% |
| Class of 2025 | 158 | 153 | 97% |
Bar Passage
The vast majority of students who enter the JD program at the Law School intend to practice law. To be admitted to the practice of law, they must first pass a state bar examination. Therefore, an important metric of student success in the JD program is the rate by which our students pass a state bar examination.
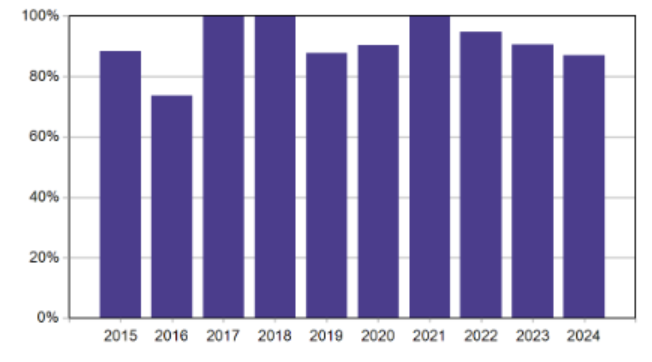
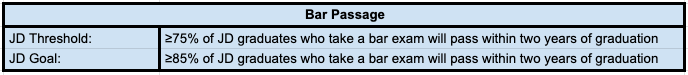
In 2018, the American Bar Association (ABA) began requiring law schools to report bar examination passage rates for graduates over a two-year period (Ultimate Bar Pass). The ABA requires that all law schools maintain or exceed an Ultimate Bar Pass rate of ≥75%. The Law School has adopted this requirement as our threshold. Our goal for Bar Passage is that ≥85% of graduates who take a bar examination pass within two years of their graduation.
Table 5. Juris Doctor Bar Passage Threshold and Goal
The Law School consistently exceeds the threshold and has exceeded the goal in every reported year. The Law School’s Ultimate Bar Pass rate was 97.1% for the class of 2020, 97% for the class of 2021, and 98.9% for the class of 2022. Given that Ultimate Bar Pass rates are not yet available for the Classes of 2023 and 2024, First-Time Bar Passage has been reported.
Table 6. Juris Doctor Bar Passage Results, Ultimate Bar Pass (2020-2022), First Time Bar Passage (2023-2024)

*First-Time Bar Passage Rates: Rate reflects how Law School graduates performed across all jurisdictions where they took the bar examination for the first time (reported within one year of graduation).
Employment
The vast majority of students who matriculate into the JD program at the Law School do so with the intention of practicing law upon graduation. Accordingly, a key indicator of student success is the rate at which graduates obtain employment in the legal profession. To this end, the Law School utilizes post-graduation employment outcomes as a principal measure of student achievement.
The ABA requires law schools to disclose standardized and detailed employment statistics for its JD graduates. Specifically, the ABA requires law schools to report the percentage of graduates who are employed in full-time, long-term positions within ten months after graduation.. Many legal employers will not hire a law school graduate until they have passed the bar exam. Therefore, the Law School has established an employment threshold in alignment with our bar passage threshold—that 75% or more of our graduates will be employed within ten months after graduation. Our goal is that 90% or more of our graduates will be employed within ten months after graduation.
The employment rate for JD graduates in full-time, long-term positions, measured at ten months following graduation, has remained consistently high over the past three years, exceeding both our threshold and goals.
Class of 2021: 97%
Class of 2022: 97%
Class of 2023: 99%
Class of 2024: 97%
Measures of Student Achievement in the LLM Program
The Master of Laws (LLM) degree is designed for attorneys who hold a first degree in law from a country outside of the United States. The program is typically completed in two semesters.
The measures of student achievement for the LLM program are the graduation rate and students’ self-reported gains in legal analysis.
Graduation Rate
Given the duration of the program the Law School has established the following threshold and goal for the graduation rates of our LLM program:
Table 7. LLM Graduation Rate Threshold and Goal

These benchmarks were developed through a collaborative process involving faculty, academic affairs leadership, and a review of historical data. The 75% threshold reflects a conservative lower boundary based on historic performance and peer comparisons where available. The two-year time frame for the threshold mirrors the end of a second academic year, which would align with the LLM degree maximum degree length of three semesters plus the allowance of a semester of voluntary leave if necessary. The 90% graduate rate within one year goal represents our commitment to student achievement and institutional effectiveness. A one-year time frame for the goal was selected because it aligns with the normative path for full-time LLM students and enables early detection of academic or support deficiencies. Both benchmarks are consistent with student expectations and accreditation principles that stress timely program completion as a meaningful indicator of student success.
The following table reflects LLM graduation rates for the most recent three graduating classes. As shown, graduation rates for the LLM program consistently meet or exceed both the established threshold and goal.
Table 8. LLM Graduation Rates, Graduating Classes 2023 – 2025
| Master of Laws (LLM) | Total Matriculants | Total Grads | |
| # | % | ||
| Class of 2023 | 10 | 10 | 100% |
| Class of 2024 | 5 | 5 | 100% |
| Class of 2025 | 4 | 3 | 75% |
Self-Reported Progress
Another measure for our LLM students is their self-reported progress in (1) understanding the fundamental legal concepts and principles; (2) identifying and framing potential legal issues; (3) applying relevant legal issues to new fact patterns; (4) communicating legal analysis in a clear and organized manner; (5) sorting large amounts of information into a useful format; and (6) developing a deep understanding of legal topics or principles.
LLM students are already licensed attorneys and experienced professionals. This program is designed to build on the expertise they have developed through their education and careers. Therefore, we believe that their self-assessment of knowledge gained from their courses is essential for measuring and demonstrating their overall success.
Our threshold for these six indicators is a semester mean of 3.5 and a goal of 4.0 on a self-reported scale of 0 to 5: (0) Not Applicable, (1) No apparent progress/negligible gains, (2) Slight progress/small gains, (3) Moderate progress/some gains, (4) Substantial progress/large gains, and (5) Exceptional progress/outstanding gains. It is the expectation of the Law School that students will experience more than moderate progress, therefore the benchmark is set slightly higher than the middle of the self-reported scale.
The following table details an average of self-reported progress across all LLM-specific courses in the program for the current and past two years. As shown, the Self-Reported Progress as a measurement of student achievement exceeds both the threshold and goal for all three reporting years
Table 9. Master of Laws (LLM) Self-Reported Progress Summary

Relevant program administrators regularly review the Self-Reported Progress results. Should the resulting summary data for the program fall near or below the established threshold, the Senior Associate Dean for Academic Affairs would review the results and refer identified concerns to the Curriculum Committee or another appropriate faculty committee for further analysis. This committee would engage directly with faculty members teaching in the LLM program, as well as with program administrators to determine underlying issues and develop targeted instructional, curricular, and administrative interventions aimed at improving student outcomes.
Measures of Student Achievement in the Doctor of Juridical Science (SJD) Program
The Doctor of Juridical Science (SJD) program serves advanced legal scholars—primarily international professionals holding both a first law degree and an LLM—who pursue scholarly research culminating in a substantial dissertation completed under the direction of a tenured faculty advisor.
Graduation Rate
The SJD program’s graduation rate serves as an important indicator of student achievement and institutional effectiveness. Because the program is designed primarily for working professionals—many of whom are international scholars or legal practitioners—students may progress through the program on a flexible timeline. As noted in the Student Handbook, SJD students must complete the degree requirements within a maximum of five years from matriculation, unless approved for an extension. During this period, students may take approved leaves of absence for professional or personal reasons, and very few students become academically ineligible.
The Law School monitors and evaluates student achievement through graduation rates disaggregated by cohort. Graduation is tracked for cohorts only after all students have either graduated or formally exited the program. This ensures that the data are complete, reliable, and appropriate for longitudinal and comparative analysis.
Table 10. SJD Graduation Rate Threshold and Goal

The 75% threshold represents a baseline level of acceptable program effectiveness, accounting for the reality that some SJD students may withdraw to pursue other personal, academic, or professional opportunities unrelated to program quality. This standard was established after longitudinal analysis of historic cohort performance and reflects the minimum level at which the program remains effective and mission-consistent. The 85% goal, by contrast, is an aspirational benchmark grounded in the Law School’s commitment to continuous improvement and academic excellence. It reflects the highly selective nature of SJD admissions, the intensive faculty engagement during the dissertation phase, and the institution’s proactive academic support strategies. The goal was set through internal faculty consultation and review of peer institution expectations for advanced law degrees.
Across the three most recent graduating cohorts (Fall 2018, Fall 2019, and Fall 2020 matriculants), the program enrolled a total of 10 SJD students, all of whom graduated within the prescribed five-year period. This results in a combined graduation rate of 100%, which exceeds both the program’s threshold and goal.
This sustained level of achievement confirms the effectiveness of the Law School’s strategies in supporting SJD student progression and degree completion, and it underscores the value of the program’s rigorous admissions process, individualized mentorship, and commitment to scholarly excellence.
Quality Dissertation
Another measure of student success in the SJD program is the successful completion of a high-quality dissertation that meets publishable standards and demonstrates an original contribution to legal scholarship. Each SJD candidate must defend the dissertation before a faculty committee and deliver a public presentation, in accordance with the requirements detailed in the Student Handbook.
• Dissertation Quality Threshold: ≥75% of SJD students will complete a dissertation that meets the required scholarly and academic standards.
• Dissertation Quality Goal: ≥85% of SJD students will meet these standards within five years of matriculation, consistent with the program’s graduation rate goal.
Performance on this metric is measured by the number of students whose dissertations are approved by their tenured faculty advisor and dissertation committee, thereby qualifying them for graduation.
Across the three most recent cohorts (Fall 2018, Fall 2019, and Fall 2020 matriculants), 100% of SJD students completed the program within five years, successfully defended their dissertations, and received committee approval for graduation. This outcome reflects full attainment of both the dissertation threshold and the aspirational goal.
These results demonstrate that the SJD program not only supports timely degree completion but also ensures that all graduates meet the rigorous standards of scholarly excellence required for the SJD degree. The close faculty mentorship model, combined with individualized academic support and structured progress monitoring, contributes significantly to this consistent record of achievement.
Measures of Student Achievement in the Master of Studies in Law (MSL) Program
The fully online Master of Studies in Law (MSL) program is designed specifically for working professionals who seek to deepen their understanding of legal principles to better manage risks and enhance decision-making in their professional environments. The program offers flexibility through a part-time schedule, enabling students to enroll in three to six credit hours per semester, thus balancing their academic endeavors with professional and personal responsibilities. Students transferring credit hours can complete the program in as few as 21 months (five terms), whereas those without transfer credits typically finish within 24 months (six terms). As outlined in the Student Handbook, students must complete their degree requirements within five years of matriculation. With three available entry points each academic year—Fall, Spring, and Summer—the program accommodates varied schedules.
Graduation Rate
MSL graduation rates serve as a crucial measure of student achievement, demonstrating the Law School’s commitment to supporting the academic progress and professional advancement of working professionals. Given the professional and personal commitments of students enrolled in the MSL program, some students may temporarily pause their studies due to career shifts, personal circumstances, or enrollment in alternative graduate programs. Instances of academic ineligibility are infrequent, evidencing the rigor and supportive nature of the program’s academic environment. The established graduation rate threshold and goal were developed through analysis of historical completion data, benchmarking against peer institutions, and with input from program faculty and administration. These benchmarks reflect the Law School’s mission to deliver rigorous, practical, and accessible legal education to working professionals.
Table 11. MSL Program Graduation Rate Threshold and Goal
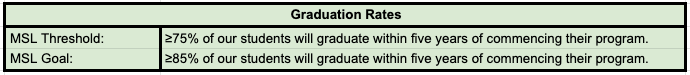
Graduation data, reported for the three most recent cohorts that have completed the five-year timeframe, reflect cohorts aggregated across all entry points within an academic year (Fall, Spring, Summer). Regular review and analysis of these data informs ongoing institutional strategies, including targeted advising to address and close any identified gaps.
Table 12. MSL Program Graduation Rates, Classes 2023-2025
| Master of Studies in Law (MSL) | Total Matriculants | Total Grads | |
| # | % | ||
| Class of 2023 | 59 | 56 | 95% |
| Class of 2024 | 55 | 45 | 82% |
| Class of 2025 | 48 | 44 | 92% |
Self-Reported Progress
Students in the MSL program provide self-reported assessments of their academic progress, focusing on their ability to: (1) understand core legal concepts and principles; (2) identify and structure potential legal issues; and (3) apply these concepts practically within their professional contexts. Given the professional orientation of students, self-assessment represents an essential indicator of their applied learning and professional growth.
A threshold of 3.85 and a goal of 4.0 on a 5-point Likert scale (1: Poor to 5: Excellent) have been established. These benchmarks, exceeding the midpoint of the scale, underscore the expectation that students achieve substantial professional and intellectual development.
The Self-Reported Progress Assessment is conducted each term. Recently, a vendor-related data access issue disrupted data collection for terms following Fall 2023; however, this has been resolved, and continuous monitoring has resumed following the 2024-2025 academic year.
Historical data available indicate consistent achievement above the established threshold and often exceeding the goal.
Table 13. MSL Self-Reported Progress Summary, Spring 2022 – Fall 2023

School of Medicine
Each degree program within the School of Medicine uses multiple measures to document student success, which is detailed below.
Academic Nursing
The Department of Academic Nursing (DAN) offers two pathways to achieve the Doctor of Nursing Practice (DNP) degree. The BSN to DNP with nurse anesthesia specialization and the Post-Masters to DNP pathways both result in the conferral of the DNP degree. The BSN to DNP with nurse anesthesia specialization pathway is separately accredited by the Council on Accreditation of Nurse Anesthesia Educational Programs (known as the COA). Graduates from the BSN to DNP specializing in nurse anesthesia are eligible to sit for the National Certification Examination (NCE). To practice as a nurse anesthetist, a graduate is required to pass the NCE to use the credential “certified registered nurse anesthetist” or CRNA. Student success and achievement within the DAN educational programs are measured by 1) overall and expected, on-time graduation rates, 2) employment rates post-degree completion in the area of study within six months; 3) employer satisfaction rates with program graduates, and 4), specific to the BSN to DNP with nurse anesthesia specialization, NCE overall and first-time pass rates.
Graduation rates
The BSN to DNP with Nurse Anesthesia specialization program has set a minimum overall graduation threshold rate of 80% with 90% as the benchmark goal. This exceeds the national standard of 80% over a 5-year running average set by the Council for Accreditation for Nurse Anesthesia Programs (COA) for nurse anesthesia programs. Table 1 below shows that the BSN to DNP with nurse anesthesia specialization program has met the threshold and benchmark goal for the past 5 years.
The Post-Master’s to DNP program has set a minimum overall graduation threshold of 70% with an 80% benchmark goal as the doctoral project can vary in length and breadth. Also, the AACN credentialing body, the Commission on Collegiate Nursing Education (CCNE), has a minimum 70% completion rate standard over a running 3-year total that exceeds this threshold. Table 1 below shows that the Post Master’s DNP program has met the threshold and benchmark goal for the past 5 years.
Table 1. Department of Academic Nursing Overall Graduation Rate By Program
| Graduation Year | Post-Master’s to DNP Graduation Rate** | BSN to DNP w/ nurse anesthesia specialization Graduation Rate |
| 2020 | 91% | 96% |
| 2021 | 100% | 100% |
| 2022 | 100% | 100% |
| 2023 | 100% | 100% |
| 2024 | 82% | 100% |
The nursing profession has historically faced challenges in recruiting students from diverse backgrounds in terms of gender, race, and ethnicity. As a graduate doctoral nursing degree-granting institution, our lack of diversity reflects the pool of applicants who
1. have an undergraduate bachelor’s degree in nursing or a master’s degree in nursing from an accredited program;
2. are licensed to practice as a professional registered nurse (RN); and
3. who have the program-specific clinical experience background where required.
Employment Rates
In addition, DAN requests employment rates post-degree completion in the area of study within six months (Table 4). The multiple outcomes of student achievement are appropriate to the institution’s mission for programs with DAN. Data for years previous of the class of 2024 for the Post-Masters DNP is not available for Table 2. 2025 data is not available at the time of this submission.
The DAN uses 2023 published data available from the AACN regarding job placement 4-6 months after graduation to establish its employment rate benchmark. AACN data do not capture DNP employment rates; however, the AACN reports 4-6 months after graduation employment rates for MSN graduates as 95%. For all DAN educational programs, the minimum threshold is set at 95% and the goal is 100%.
Table 2. Department of Academic Nursing Overall Employment Rates within six (6) months of graduation
| Graduation Year | Post-Master’s to DNP | NAP BSN to DNP w/ nurse anesthesia specialization |
| 2020 | N/A | 100% |
| 2021 | N/A | 100% |
| 2022 | N/A | 100% |
| 2023 | N/A | 100% |
| 2024 | 100% | 100% |
Employer Satisfaction Rates
Student success and achievement within the DAN educational programs are measured by employer satisfaction rates with program graduates (see Table 3). This metric is meaningful as it represents didactic and clinical program excellence. Employee satisfaction in the United States historically hovers in the mid-60%, and there are no nursing-specific data sets that describe employer satisfaction rates of DNP-prepared nurses. The DAN considered using an initial employer satisfaction rate of 65% consistent with employee satisfaction rates nationally; however, as a good steward of higher education with the delivery of quality graduate programs, the DAN uses a threshold employer satisfaction rate of 80%. The DAN goal for employer satisfaction is 90%.
Table 3. Department of Academic Nursing Employer Satisfaction Rates
| Graduation Year | Post-Master’s to DNP | BSN to DNP w/ nurse anesthesia specialization |
| 2020 | N/A | N/A |
| 2021 (n-0) | N/A | 95% |
| 2022 (n-2) | N/A | 98% |
| 2023 | N/A | 100% |
| 2024 | N/A | 100% |
NBCRNA NCE First Time Pass Rates (Only Post-BSN to DNP w/Nurse Anesthesia Specialization)
To begin a career as a Certified Registered Nurse Anesthetist (CRNA), the National Board of Certification and Recertification for Nurse Anesthetists (NBCRNA) requires that students pass the National Certification Examination (NCE). The BSN to DNP with nurse anesthesia specialization sets its minimum benchmark performance threshold at 80%, which is consistent with the COA specialty accreditor policy. The following describes the options available to nurse anesthesia educational programs to determine first time NCE pass rate for a graduating cohort in compliance with the COA policy:
Method 1: the number of graduates in the most recent graduation cohort who passed the NCE on their first attempt.
Method 2: the number of graduates in the three most recent graduation cohorts who passed the NCE on their first attempt.
Method 3: the number of graduates in the most recent graduation cohort who passed the NCE on their first attempt plus the number of graduates who passed the NCE on their second attempt within 60 days of the program completion.
The BSN to DNP with nurse anesthesia specialization track also sets a preferred goal of 90% for first time NCE pass rates for each graduating cohort using one of the three COA methods used for calculating the pass rate. The average NCE first-time and overall pass rates for a graduating BSN to DNP with nurse anesthesia specialization cohort is published annually on the WFU website. The past five years of NCE first-time and overall pass rates appears in Table 4.
Table 4. NBCRNA NCE Performance Scores
| Class | First Time Pass Rate | Overall Pass Rate | COA method by which first time pass rate was calculated |
| 2019 | 100% | 100% | Not applicable (2019 predates the current policy) |
| 2020 | 95% | 100% | Not applicable (2019 predates the current policy) |
| 2021 | 95% | 100% | Method 1 |
| 2022 | 88% | 100% | Method 1 |
| 2023 | 95% | 100% | Method 1 |
| 2024 | 92% | 96% as off 6/11/25 | Method 1 |
Doctor of Medicine (MD)
The MD assessment program, along with our entire curriculum, is overseen by the Undergraduate Medical Education Curriculum Committee (UMECC) and its four subcommittees in a process of continuous quality improvement. Our curriculum has high-stakes assessment events that must be successfully passed for students to continue in the curriculum. Criteria and thresholds for achievement are determined and proposed by our content and assessment experts serving as course/clerkship directors in collaboration with our assessment teams. But ultimately, these performance thresholds are set and re-considered by UMECC in a process of continuous quality improvement and faculty oversight. The Office of Undergraduate Medical Education monitors student achievement and performance against student learning outcomes. Evidence of improvement in educational outcomes includes improved student performance on national exams. The robust curricular assessment program overseen by UMECC has proven extremely successful in preparing students for patient care roles and service in residency programs.
Educational Program Objectives
The MD program educational program objectives (EPO) are reviewed and approved annually by the Undergraduate Medical Education Curriculum Committee (UMECC). They were last reviewed at the UMECC meeting on August 1, 2024. Each of the eight EPOs has specific thresholds and goals, which are evaluated annually by UMECC through the EPO dashboard. Every EPO maintains its own dashboard featuring national and institutional performance indicators, each with distinct metrics being monitored. Students are made aware of the EPO’s via the MD Student Handbook.
Graduation Rate
Our Undergraduate Medical Education Curriculum Committee (UMECC) has set a minimum threshold of 80% with a goal of 85% for our overall graduation rate. Using the Association of American Medical Colleges (AAMC) data snapshot of graduation and attrition rates of U.S. medical students, the UMECC believed that this is a meaningful metric given that the national medical school graduation rates for non-combination degree MD students ranged from 82% to 84%. Six years after matriculation, the national average graduation rate was 96% of non-combination degree MD students. Our program’s curriculum and student support processes allow most of our students to successfully complete our MD program curriculum within four years of matriculation. As evidenced below in Table 5, the overall graduation rates for the last four cohorts met or exceeded our goal of 80%.
Table 5. Doctor of Medicine (MD) Overall Graduation Rate
| Class Graduation Year | On-Time Graduation Rate* | Overall Graduation Rate |
| 2022 | 87% | 92% |
| 2023 | 88% | 88% |
| 2024 | 88% | 88% |
| 2025 | 90% | 91% |
* On-time graduation rate shows the students who completed the program in the 4 years that are required. Overall graduation rate shows the students who completed the program.
National Board Examinations
An important signal showing the success of curricular assessment is student performance on high-stakes national board examinations. These benchmarked examinations provide excellent information regarding relative performance of our students compared to all LCME accredited MD/DO programs in the US and Canada.
The UMECC has established a minimum performance standard of 70% correct as the passing threshold for board-style examinations in preclinical foundational science courses with an overall goal of 80% passing rate. Students who do not meet this standard must complete a structured remediation process. For learning objectives that cannot be effectively assessed through multiple-choice questions (e.g., Personal and Professional Development), our assessment methods remain rigorous and appropriate. Passing criteria vary based on the curricular content. For example, for clinical skills training in preclinical courses, students are required to perform physical examination skills with patient actors in a simulation suite. These sessions are fully observed and graded by faculty using a detailed rubric; and the passing score is predetermined and clearly shared with students in advance. Another example is the personal and professional development is assessed through direct observation of student performance by practicing clinicians in patient-facing settings. UMECC oversees all grading practices and the determination of passing thresholds, which are reviewed regularly as part of a continuous quality improvement (CQI) process.
Our students consistently perform extremely well on these examinations, and their individual performance on these national exams correlates extremely well with their performance on our Wake Curricular assessments. Performance standards for national exams have been set by UMECC for at or above the national average. The percent pass rate for WFUSM first-time takers of the United States Medical Licensing Examination (USMLE) Step 1 (Table 6) has consistently been above the national mean over the past five years; the mean has been within three points of the national average (Step 1 Exam connects to the Knowledge for Practice and Patient Care program objectives). The percent pass rate for WFUSM first-time takers of USMLE Step 2 Clinical Knowledge (Table 7) has been at or above the national mean over the past three years (Step 2 Exam connects to the Interpersonal and Communication Skills, Patient Care, and System Based Practice program objectives). Data for 2025 were not available at time of report submission.
Table 6. United States Medical Licensing Examination (USMLE) Step 1
| Year | # of Examinees | School Pass Rate | National Pass Rate |
| 2022 | 147 | 97% | 93% |
| 2023 | 143 | 96% | 92% |
| 2024 | 142 | 94% | 91% |
Table 7. United States Medical Licensing Examination (USMLE) Step 2 CK
| Year | # of Examinees | School Pass Rate | National Pass Rate |
| 2022 | 209 | 99% | 99% |
| 2023 | 214 | 99% | 98% |
| 2024 | 214 | 99% | 98% |
Placement for Residency
The National Residency Matching Program (NRMP; The Match) is a private, non-profit organization that implements the process by which the preferences of MD student applicants for U.S. residency positions are matched with the preferences of residency program directors. While WFUSM seeks to match 100% of its students with residencies, our Undergraduate Medical Education Curriculum Committee (UMECC) chose a performance metric (goal and threshold) of 95% of the 5-year average national match rate for allopathic US seniors into PGY-1 positions. The UMECC determined this approach to evaluating our Match Rate is meaningful because it highlights the excellent training provided by WFUSM that makes our students and graduates highly competitive for residency training positions. All students who have entered the match have been very successful in obtaining residency positions (connects to Knowledge for Practice, Patient Care, and Personal and Professional Development program objectives). The national residency match is an important practical outcome for MD program students, determining placement for their next stage of training. To achieve that goal we provide extensive career advising support for the match process, in addition to an outstanding curriculum and assessment program.
The success of graduating students in placement for residency training is monitored and published annually.
Table 8. 5-year Match Rate
| Match Year | Match Rate |
| 2021 | 98% |
| 2022 | 96% |
| 2023 | 99% |
| 2024 | 97% |
| 2025 | 99% |
Physician Assistant Program
The Physician Assistant Master of Medical Science (PA-MMS) Program evaluates success with respect to student achievement consistent with its mission to produce highly capable, compassionate PAs who make significant contributions to the health care community.
PANCE Pass Rates (first time takers)
Goal
Prepare graduates who are proficient in medical knowledge for entry into the PA profession.
Rationale
The PA Program documents successful student achievement in relation to its mission by monitoring and reporting the percentage of each cohort of graduates that pass the Physician Assistant National Certification Exam (PANCE) on the first attempt. Because all 50 states, the military and federal health services mandate that PAs pass the PANCE in order to obtain licensure and/or full practice authority, the Wake Forest PA Program prioritizes the importance of demonstrating PA graduates’ ability to actually enter the profession.
Benchmark
The program goal for first-time test taker pass performance on PANCE is a 90% or higher. This expectation exceeds the ARC-PA’s and our threshold of 85% alert value, which requires mandatory action if the pass rate falls below this. The program also uses the national mean for first time test takers as a surrogate marker of our competitiveness. Thus, our cohorts’ surpassing the national mean each year serves as an additional measure of success.
Outcomes measures
The percent pass rate for Wake Forest PA Program first-time takers of the PANCE has exceeded our goal of 90% and has been at or above the national first-time pass rate every year. The compiled five-year average for the first-time pass rate for WFUSM PA Program is 96%, and the national average is 93%. (See Table 9)
Table 9. PANCE Pass Rates – First Time Examinee
| Class Graduating Year | Number of 1st Time WFUPA Takers | WFUPA Program 1st Time Take Pass Rate | National 1st Time Taker Pass Rate for the Class Graduation Year |
| 2019 | 84 | 98% | 93% |
| 2020 | 86 | 98% | 95% |
| 2021 | 85 | 95% | 93% |
| 2022 | 88 | 92% | 92% |
| 2023 | 85 | 96% | 92% |
| 2024 | 86 | 94% | 92% |
Graduation rate
Goal
Support enrolled students through graduation from the program with a Master of Medical Science degree.
Rationale
To meet the aim of successful graduation for each enrollee, the faculty and staff within the Wake Forest PA Program facilitates the education of students in program competencies and learning outcomes and provides the necessary support to complete all requirements for graduation.
Benchmark
On-time graduation rates threshold and goal will meet or exceed 94% and total cohort graduation rates threshold and goal will meet or exceed 97%. In addition, graduation rates for Wake Forest PA will exceed the national average for all PA programs.
Outcomes measures
The program measures student success by evaluating graduation rates for two timelines. The table reflects graduation rates by cohort, based upon the numbers of students who graduated on time or on a later timeline. The PA Program’s on-time graduation rates have ranged from 94 to 99% over the past five years, with total cohort graduation rates ranging from 98 to 100%.
The on-time and total cohort graduation benchmarks for each cohort are established by comparing that cohort to the five prior cohorts. The threshold for a cohort is to fall within 1 standard deviation of the mean of the combined on-time graduation rates of the prior five cohorts. For every group, the threshold was met.
In addition, the PA Program is able to utilize an additional benchmark of the mean on-time graduation rate for all PA programs, as posted in the most recent PA Education Association (PAEA) Program Survey. In the 2024 report, the total program on-time graduation average was 94%. In comparison, every on-time graduating cohort listed in Table 10met or exceeded this percentage.
Table 10: Full Cohort PA Graduation Rates
| Class Graduation Year | Total Cohort Graduation Rate | On Time Graduation Rate |
| 2019 | 98% | 94% |
| 2020 | 99% | 96% |
| 2021 | 98% | 94% |
| 2022 | 99% | 98% |
| 2023 | 98% | 96% |
| 2024 | 99% | 97% |
| 2025 | 93%* | 86% |
*Anticipated
In addition to evaluating full cohort graduation rates, the PA Program reviews the outcomes of sub-groups that are important to the mission and goals for the program. These include Innovation Quarter OCIS and Leon Levine Hall of Health Sciences OCIS campus rates and disparity to non-disparity student rates.
Two-campus graduation rate comparison
Goal
Support all enrolled students through graduation from the program with a Master of Medical Science degree. The PA Program’s expansion campus graduation rates will compare favorably to the main campus graduation rates.
Rationale
The Wake Forest School of Medicine PA Program is accredited for two campuses, the main campus located at Innovation Quarter OCIS in Winston-Salem, NC and the Leon Levine Hall of Health Sciences OCIS in Boone, NC. As required by the accrediting body, Accreditation Review Commission on Education for the Physician Assistant (ARC-PA), the PA Program must demonstrate equivalency of student outcomes between those two campuses. Thus, graduation rates for both cohorts in each class year are compared, particularly to ensure that the Leon Levine Hall of Health Sciences OCIS provides a parallel educational experience to the main campus.
Benchmark/Threshold
There will be no difference in graduation rates for the Leon Levine Hall of Health Sciences OCIS students. Minor variations will not be statistically significant.
Outcomes
For the five posted years, results of both total cohort and on-time graduation rates for the Leon Levine Hall of Health Sciences OCIS (Boone) campus demonstrate favorable comparability. Any differences between cohorts are not statistically significant (see Table 11.)
Table 11. Differentiation by Innovation Quarter OCIS (Winston-Salem) and Leon Levine Hall of Health Sciences OCIS (Boone)
| Class Graduation Year/ Campus | On-time Graduation Rate | Total Cohort Graduation Rate |
| 2019 Leon Levine Hall | 96% | 100% |
| 2019 Innovation Quarter | 97%* | 100% |
| 2020 Leon Levine Hall | 96% | 100% |
| 2020 Innovation Quarter | 97% | 98% |
| 2021 Leon Levine Hall | 96% | 100% |
| 2021 Innovation Quarter | 95%* | 97% |
| 2022 Leon Levine Hall | 100% | 100% |
| 2022 Innovation Quarter | 97%* | 98% |
| 2023 Leon Levine Hall | 96% | 100% |
| 2023 Innovation Quarter | 95% | 97% |
| 2024 Leon Levine Hall | 91% | 96% |
| 2024 Innovation Quarter | 98% | 100% |
| 2025 Leon Levine Hall | 74% | 91%* |
| 2025 Innovation Quarter | 91% | 94%* |
*Reflects that several students in these cohorts exited the program prior to student placement on the different campuses and were therefore not included in the campus-to-campus data.
Physician Assistant Doctor of Medical Science (PA-DMSc)
The Physician Assistant Doctor of Medical Science (PA-DMSc) Program enrolled its first cohort of students in summer 2024. The following are program level outcomes that will be tracked moving forward.
The PA-DMSc Program evaluates its success with respect to student achievement consistent with its mission to develop advanced leaders in healthcare. As the program enrolled its inaugural cohort in Summer 2024, the following outcomes and metrics will be tracked to measure student success and program impact:
Graduation and On-Time Completion Rates
Goal: Support students to successfully graduate within the expected program timeline.
Benchmark: At least 90% of enrolled students will complete the program on time, with a total graduation rate of 90% or higher for each cohort.
Rationale: High graduation and on-time completion rates reflect the program’s ability to support students’ progress toward degree attainment while maintaining academic rigor.
Capstone Project Completion and Dissemination
Goal: Ensure students complete a capstone project that demonstrates original research, culminating in peer-reviewed dissemination.
Benchmark: 100% of graduates complete a capstone project and submit their project manuscript to a peer-reviewed journal for publication and dissemination of their findings.
Rationale: The capstone project demonstrates the program’s emphasis on contributing to the healthcare profession through research and scholarship.
Student Satisfaction and Program Effectiveness
Goal: Achieve high levels of student satisfaction regarding program quality, faculty support, and preparedness for advanced roles.
Benchmark: Fewer than 10% of students will report dissatisfaction (rating of 1 or 2 on a 5-point scale, where 1 is very dissatisfied, 2 is dissatisfied, 3 is neutral, 4 is satisfied, and 5 is very satisfied) on end-of-program surveys.
Rationale: Student satisfaction provides valuable insights into program effectiveness and areas for improvement.
These benchmarks are tracked and reviewed systematically by the Program Director to identify individual and cohort performance trends. While the program will compare cohort-to-cohort data to identify trends in the future, we are currently working with our inaugural cohort, so trend analysis will be developed as more cohorts complete the program.
Professional Studies
The School of Professional Studies (SPS) has identified goals for student achievement appropriate to its mission, the nature of the students it serves, and the kinds of programs offered. SPS uses multiple measures to document student success. Student achievement measures are evaluated on a consistent basis.
SPS launched its first two online master’s degree programs, Digital Marketing and Project Management, in Spring 2022. Since then, SPS has continued to expand its academic portfolio in the areas of business/technology, health care, education and public service.
Identification of goals and outcomes for student achievement
The mission of SPS is to provide accessible, flexible, and academically strong programs designed for working professionals. Accordingly, the SPS uses several measures to document student achievement:
- Student retention rates – A degree student is defined as retained if they successfully transition from their first year to the second year of their program and attempt the second year requirements of their program.
- Student graduation rates – Graduation rate is calculated as a percentage of students who graduate or complete their program within eight semesters (approximately 150% of the program length).
- Employment outcomes – Employment outcomes is calculated as the percentage of graduates who report that they received a raise, promotion, or new job responsibilities assessed through an annual alumni survey administered each spring.
Each measure is in alignment with the SPS mission statement to accelerate the professional growth of adult learners across their careers through accessible, flexible, and cutting-edge educational experiences. Both the retention and completion rate measures provide comprehensive evidence of student achievement at SPS. In addition, employment outcomes is a measure of graduates’ preparation to succeed in their chosen professional role. Since these programs are designed to enhance the skills of working professionals, it is anticipated that graduates will be better prepared for enhanced employment outcomes, such as promotions, raises, and new job opportunities.
In order to evaluate student achievement utilizing the identified measures, actual performance is compared to both a threshold of acceptability and a goal. The threshold of acceptability is the minimum level at which a measure should be maintained. The goal is the target performance level to meet or exceed. SPS programs are offered fully online to provide flexibility for working student populations. With this in mind, while noting a relative paucity of published data related to achievement outcomes for professional graduate programs that align with those currently offered by SPS, the following thresholds of acceptability and goals have been established based on comparisons to the range of outcomes available from other schools of professional study.
- Student retention rates – Threshold of acceptability = 70%; Goal = 85%
- Student graduation rates – Threshold of acceptability = 60%; Goal = 75%
- Employment outcomes – Threshold of acceptability = 50%; Goal = 75%
Student achievement analysis will eventually incorporate historical SPS performance on each measure to determine the utility of identified measures and goals in informing continuous improvement efforts.
Evaluation of goals and outcomes for student achievement
SPS follows an ongoing outcomes analysis process to ensure achievement data are evaluated and improvements are made based on those data. Available student achievement data are analyzed and compared against established thresholds and goals to identify whether any outcomes require improvement each year. If change interventions are implemented, the impact of those changes are reviewed as a part of the ongoing process.
SPS currently offers 12 master’s degree programs. As programs are first launched, courses are created gradually with the program development being fully completed as the final capstone course is offered for the first time. Since the current programs offered through the SPS only began in January 2022, student achievement data are not yet available for all programs. Table 1 below lists each online master’s degree program with its date of launch and actual, planned semester for the capstone course to be offered for the first time, and earliest date of availability for student achievement measures.
Table 1. SPS Academic Portfolio Launch Timeline
| Master’s Degree | Launch Date | First Offering Capstone Course | Student Retention Rate Availability | Graduation Rate Availability | Employment Outcomes Availability |
| Project Management | Spring 2022 | Summer 2023 | Spring 2023 | Fall 2024 | Spring 2024 |
| Digital Marketing | Spring 2022 | Summer 2023 | Spring 2023 | Fall 2024 | Spring 2024 |
| Financial Technology & Analytics | Fall 2022 | Spring 2024 | Fall 2023 | Summer 2025 | Spring 2025 |
| Health Informatics | Fall 2022 | Spring 2024 | Fall 2023 | Summer 2025 | Spring 2025 |
| Communications | Spring 2023 | Summer 2024 | Spring 2024 | Fall 2025 | Spring 2025 |
| Curriculum & Instruction | Spring 2023 | Summer 2024 | Spring 2024 | Fall 2025 | Spring 2025 |
| Educational Leadership | Fall 2023 | Spring 2025 | Fall 2024 | Summer 2026 | Spring 2026 |
| Health Administration | Fall 2023 | Summer 2025 | Fall 2024 | Fall2026 | Spring 2026 |
| Public Administration | Fall 2024 | Spring 2026 | Fall 2025 | Summer 2027 | Spring 2027 |
| Enterprise Risk Management | Fall 2024 | Spring 2026 | Fall 2025 | Summer 2027 | Spring 2027 |
| Artificial Intelligence | Fall 2025 | Spring 2027 | Fall 2026 | Summer 2028 | Spring 2028 |
| Cybersecurity Leadership | Fall 2025 | Spring 2027 | Fall 2026 | Summer 2028 | Spring 2028 |
Table 2 shows that student retention rates meet the established threshold of acceptability. In relation to the established goal, however, overall retention rates exceeded the goal in 2023 but fell slightly below in 2024 and 2025.
Table 2. Overall student retention rates
| Threshold | Goal | 2023 | 2024 | 2025 | |
| Overall | 70% | 85% | 87% | 80% | 80% |
These fluctuations highlight the need for ongoing monitoring and evaluation and additional data to identify persistent trends and inform targeted improvement efforts. Even though additional data may be necessary to better understand any evident disparities in retention rates over time, SPS has improvement measures in place. To better and more proactively identify at-risk students, particularly those that data indicate may be less likely to persist, SPS will implement an early alert and communication system in the 2025-2026 academic year that provides real-time data to support learner analytics.
Table 3 shows overall student graduation rates for those programs who have graduated students within approximately 150% of the program length.
Table 3. Student graduation rates
| Threshold | Goal | 2024 | 2025 | |
| Overall | 60% | 75% | 83% | 83% |
Overall graduation rates have exceeded both the threshold of acceptability as well as the goal. Ongoing monitoring will continue to evaluate data and determine if specific strategies for improvement are needed in the future.
Table 4 shows employment outcomes, measured by the percentage of alumni who report that they received a raise, promotion, or new job responsibilities assessed through an annual alumni survey administered each spring.
Table 4. Employment outcomes
| Threshold | Goal | 2024 | 2025 |
| 50% | 75% | 60% | 60% |
While initial outcomes exceed the threshold of acceptability, the goal was not met for 2024 or 2025. To help support students in advancing their career goals, a number of resources are available that will continue to be promoted during enrollment:
- Career Exploration (information and resources for those pivoting into a new career or doing a job search)
- Tips/Templates (resources for creating a resume, writing a cover letter, and interviewing)
- Career Maven Resources (access to free 1:1 career coaching sessions, library of webinar recordings, and companion piece articles)
- Continuous Learning & Professional Development (change management and skill development articles/resources like LinkedIn learning and Skillpop)
- Networking (information about WakeNetwork, Program Advisory Boards, and general networking resources)
- Career-Related Discussion Boards (boards where alumni/students can share job opportunities or news about promotions/new jobs, etc.).